Data Visualization 📊
Braxton Analytics has developed hundreds of dashboards across various industries. From the regular maintenence of reporting, to the enhancements and refinements that come over time as the business evolves, to brand new dashboards and full dashboard migrations, Braxton Analytics has delivered on dashboard development and implementation projects.
We analyze the business needs, gather reporting requirements, validate the data, and confirm the dashboard is functioning properly. This development process allows us to successfully build sustainable dashboards that accurately reflect your businesses performance.
Valuable dashboards get viewed regularly and drive data driven decisions. Poor dashboard’s leave users with more questions than answers.
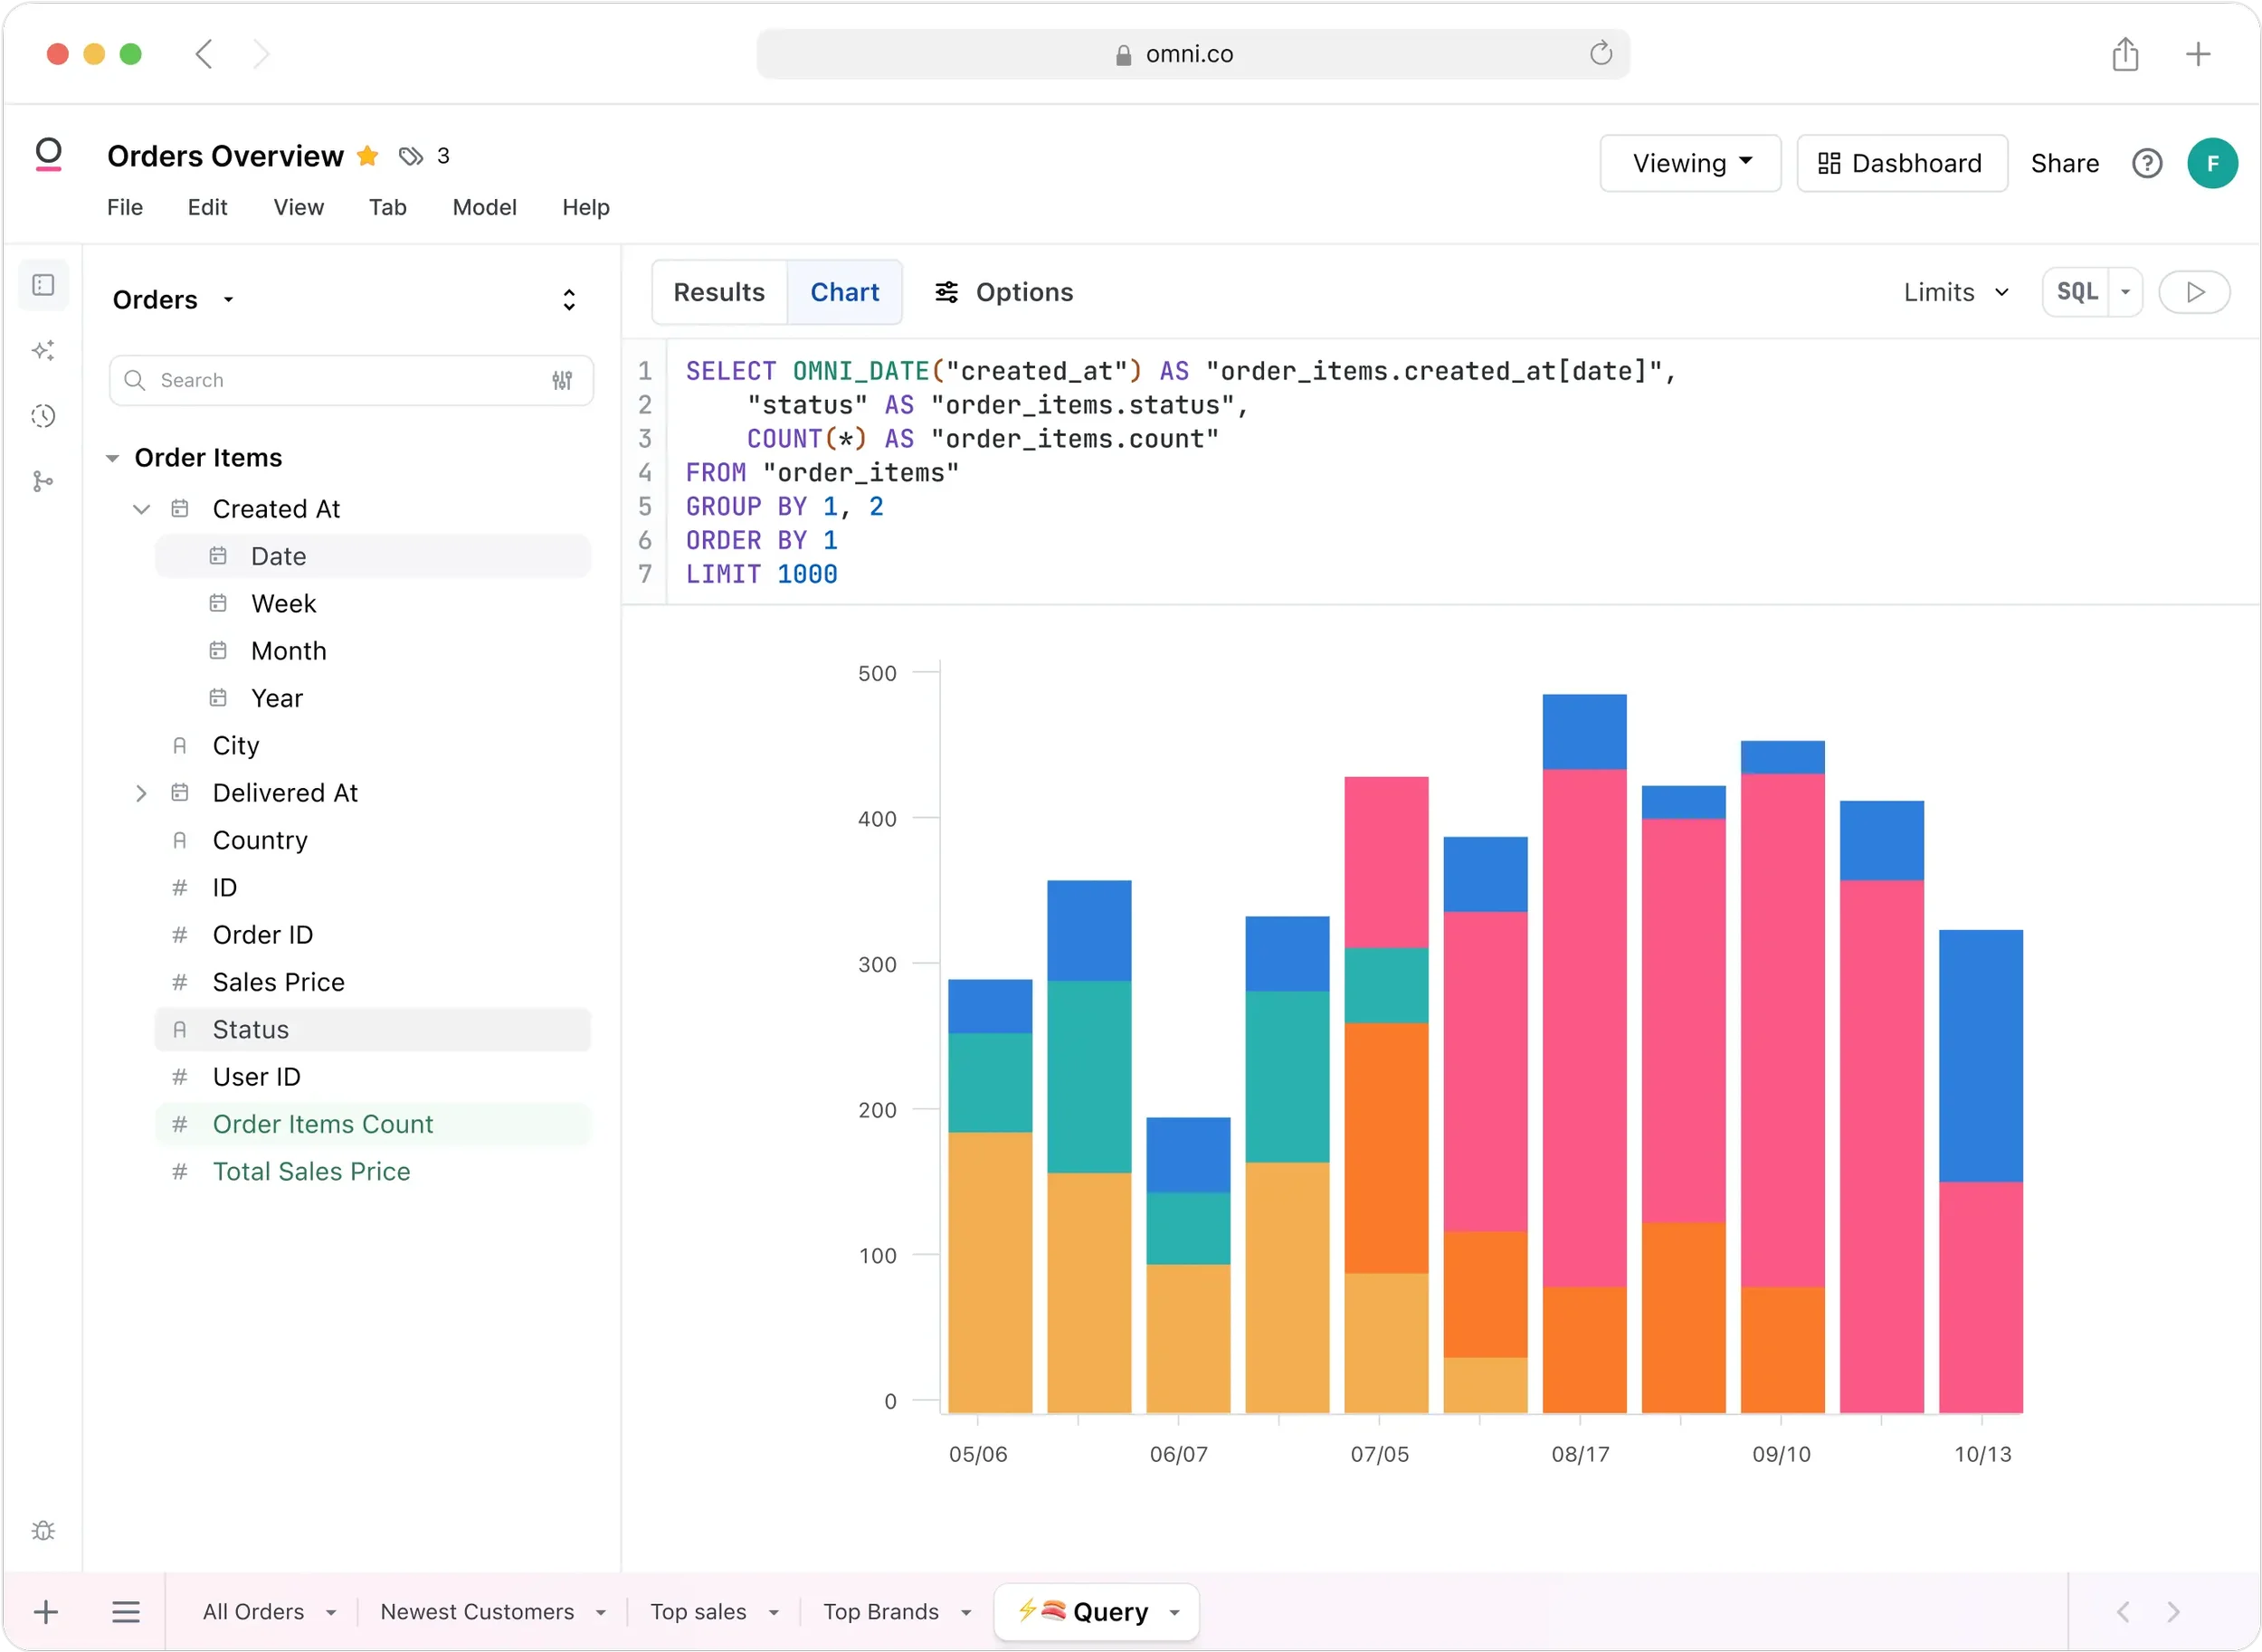
Visualize data with Omni
Braxton Analytics has experience doing Omni implementations. Leveraging Omni’s semantic layer, AI components and modern data visualization platform, Braxton Analytics can modernize your dashboard experience for your organization through Omni Analytics.
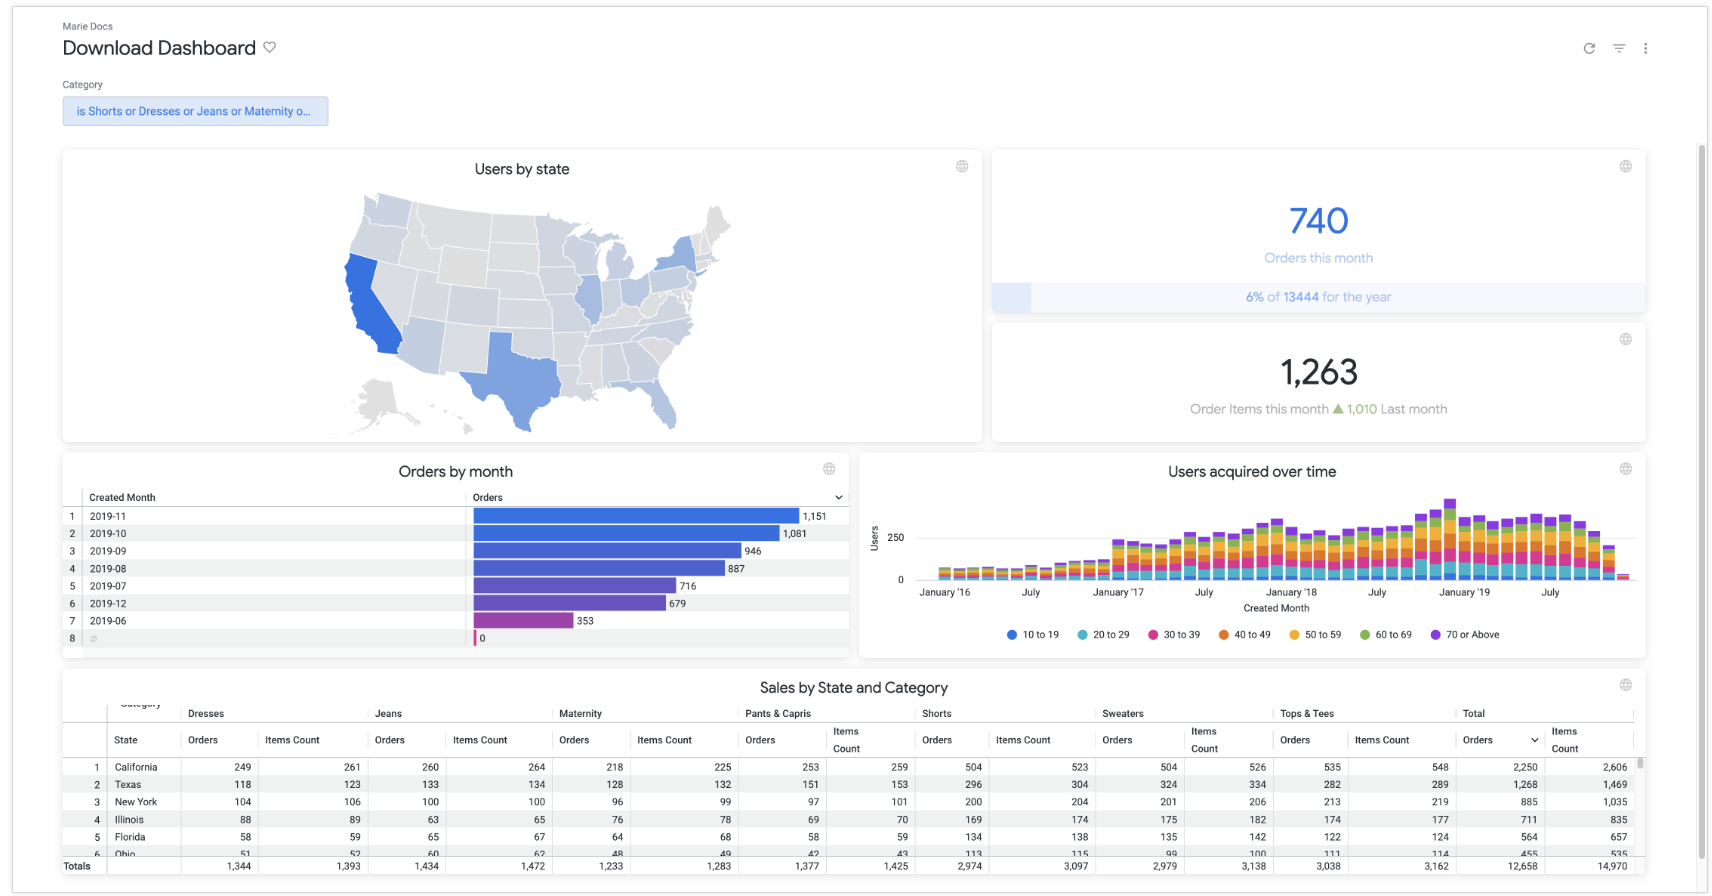
Visualize data with Looker
Braxton Analytics has deep experience developing in Looker. Leveraging Looker’s semantic layer and the LookML code to the tiles that pop out on the dashboards, Braxton Analytics is able to analyze and visualize your data within Google Cloud’s Looker product.